Table of Content
Is Android or iOS more popular?
Short answer, Android.
Long answer, it depends.
Although the global Android vs iOS market share statistics name Android as the most popular mobile operating system (OS), individuals living in different continents, or let alone countries, will have a different say.
It is interesting to note that the Symbian OS owned by Nokia, which was the most popular mobile operating system until 2010, is nowhere to be seen now. When Android was released in 2007, Nokia even made a statement that “we don’t see this as a threat”.
The wide adoption of Android devices was the first reason for Symbian operating system’s downfall. Secondly, a device running on Symbian took 22 months to develop – which was incredibly slow for a manufacturer, especially when considering the competition aspect of the smartphone industry.
 Global Android vs iOS market share. Image Credit: deviceatlas.com
Fast forward a few years, Android and iOS combined represent the majority of the global mobile OS market. However, the Android vs iOS market share is highly dynamic across the globe. Here are some exciting facts and stats about iOS and Android device market share that will blow your mind.
 Credit: dobienews.scuc.txed.net
Interesting Facts About Android vs iOS Market Share
- Google’s Android and Apple’s iOS combined represent 99% of the global mobile OS market.
- According to StatCounter, in 2020, Android owned 71.93% of the worldwide mobile operating system market share while iOS took 27.47%.
- In 2020, Sensor Tower reported that global consumer spending in mobile applications peaked at a record $111 billion, a significant 30% rise from 2019. This estimated figure encompassed all spending on subscriptions, in-app purchases, and premium apps across Google and Apple App Stores.
- To further demonstrate the above figures from the Sensor Tower annual report, worldwide consumer spending on the Apple App Store in 2020 was $72.3 billion, a 30.3% rise from $55.5B in 2019. While on Google Play in 2020, consumers spent close to $38.6 billion, another notable rise from $29.7B in 2019.
- In 2024, 1.492 billion units of smartphones will be sold globally, which would comprise only Android and iOS devices.
- iPhone users are wealthier than their Android counterparts – meaning, the former is more likely to make an in-app purchase.
- The Android vs iOS market share in the US is dominated by iOS.
- Almost every age group prefers Android devices over the iPhone.
- iPhone buyers are more loyal than their Android counterparts.
- The iOS vs Android market share in Japan is dominated by iOS, constituting 62.69%.
- Google’s Play Store has more apps (2.56 million) than Apple’s App Store (1.85 million).
- According to Tech Crunch, 2020 saw over 218 billion mobile app downloads across the Apple and Google App Stores.
- In the same breadth, Statista reported that the most popular app categories globally in 2020 in both Google Play and the App Store were games (approximately 24.63%), business (with an estimated 9.76%), and education (8.52%).
- Essentially, games are the most typically developed apps across all stores. It is estimated that 65% of smartphones have one gaming app. However, more than 90% of smartphones have at least a web browser, social media apps, entertainment apps or shopping apps.
- Android has more alternative app stores than iOS.
- Native English speakers prefer iOS over Android.
- The Android vs iOS market share in the UK is almost a 50-50 scenario.
- Asia’s iOS vs Android market share shows a substantial gap between the two, with Android’s usage steadily increasing.
Android Version Market Share
Here’s a table that shows the Android version market share from 2016 to 2020.
Here are a few noteworthy Android-specific statistics to better paint the picture of the breadth of its global market share:
- According to the IDC, Android’s smartphone market share is expected to peak at 85.5% by 2022.
- The Google Play Store maintains the most apps created by developers in its vast library, with an estimated 2.87 million apps for users to select from.
- In this same vein, by October 2020, there were approximately 385,551 gaming apps available on Google Play.
iOS Version Market Share
A remarkable feat on its own, in 2020, Apple became the most valuable publicly traded company on the globe. To be more specific, according to CNBC, in September 2020, Apple became the first US-listed company to arrive at a $2 trillion market capitalization. This should be a striking testament to its successful growth in the mobile application sphere over the past decade.
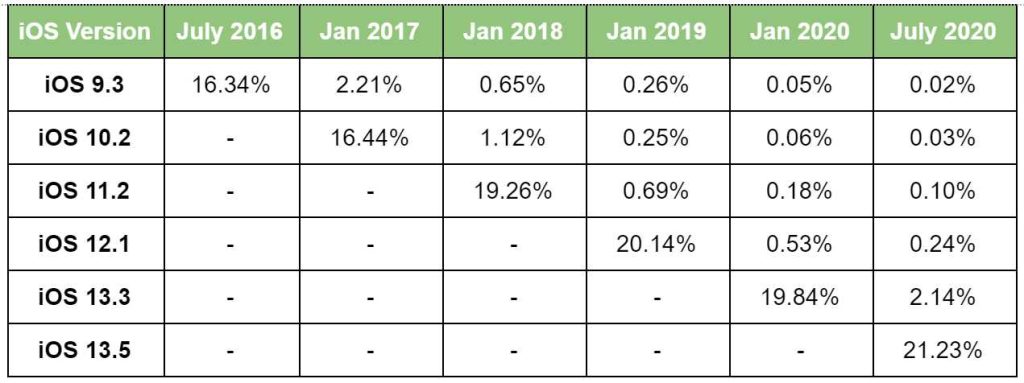
Here’s a table that shows the iOS version market share from 2016 to 2020.
Here are some iOS Statistics to highlight the depth of its market penetration:
- The Apple App Store maintains over 1.96 million functional apps as of 2020 figures.
- In 2020, Apple’s App Store generated 87.3% more in consumer spending than Google’s Play Store, according to Sensor Tower. This is considered a historical trend.
- According to Tadviser, in 2019, Apple’s global revenue reached $260.17 billion.
Android vs iOS Market Share Worldwide by Continent
1. Asia
Android is the most favoured mobile operating system in the world’s most populous continent and accounts for 83.53% of smartphones. iOS represents just 15.85% – a minority in this scale.
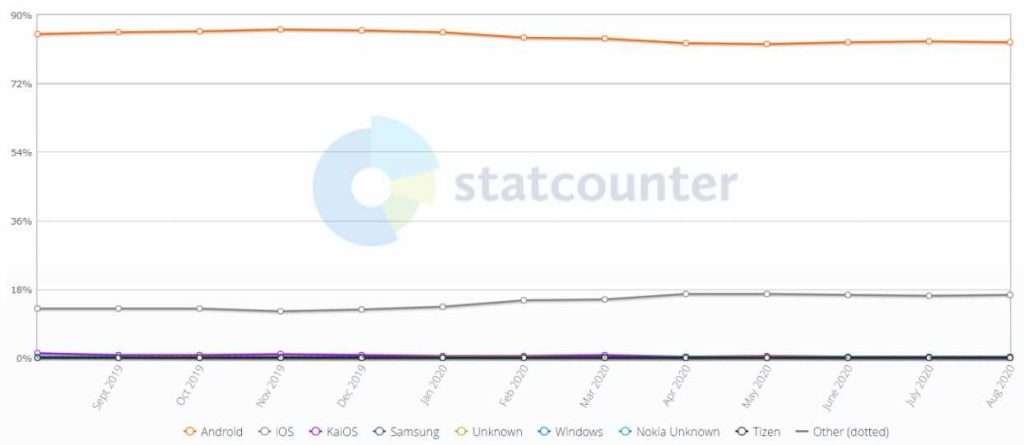 Image Credit: gs.statcounter.com
Here are a few statistics to shade more light on the magnitude of Asian mobile application market:
- According to AppInChina, in 2020, Tencent My App was the Android App Store with the highest market share (estimated at 26.46%) in China.
- According to Forbes, in 2019, China accounted for 40% of mobile App spending worldwide. This should not come as a surprise as it is reported that more than 80% of Chinese prefer to use Android smartphones.
- Statista estimates that there are approximately 3.7 million mobile apps in China app stores, as of 2020. Principally, by May 2020, an estimated 79.39% of most Chinese smartphones ran on Android while 19.76% ran on iOS.
- In 2020, Xiaomi was the best-selling smartphone manufacturer in India.
- Previously, Apple was estimated to have a 3% market share in India. However, present surveys indicate that Apple’s market share in India increased from 2% to 4%. This rise can be attributed to the entry of the iPhone SE into the Indian market. The iPhone SE is currently manufactured in India and its average $484 cost may have opened doors for Apple in many Indian households.
- According to Statista, by 2023, China should be leading the Asian region by a stretch with a projected 147.2 billion annual mobile application downloads.
2. Africa
Africa, the world’s second-most populous continent is dominated by Android devices, accounting for 87.22% of the mobile OS market. iOS is again a minority here and accounts for 10.16% of the market.
In terms of device vendors, throughout 2020, Samsung was Africa’s market leader with 32.93% of the market share of mobile device manufacturers in Africa. Huawei came in second with 17.83%, followed by Apple with 13.86% of the market share.
 Image Credit: gs.statcounter.com
3. North America
iOS leads the North American mobile OS market, comprising 53.55% of smartphones, followed by Android at 46.24%.
Pertaining to the device vendors, in the entire North America, Apple convincingly beats its competitors with a 56.22% market share, while Samsung maintains a 25.05% market share, and LG comes in third with 4.07% market share.
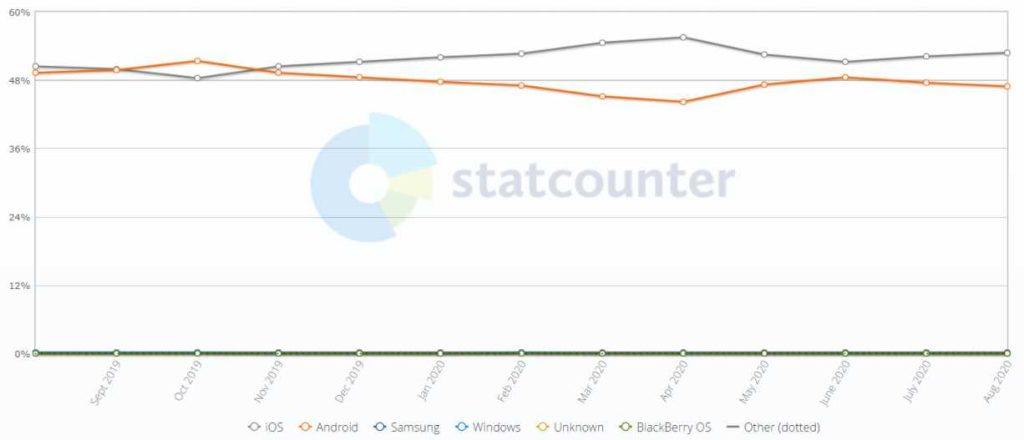 Image Credit: gs.statcounter.com
4. South America
88.37% of smartphones in South America run on Android, followed by iOS at 11.36%.
South America’s mobile device market is championed by Samsung with an estimated 46% market share, followed by Motorola at 16.86%, and then Apple with a 10.9% market share.
 Image Credit: gs.statcounter.com
5. Europe
72.87% of smartphones in Europe have Android as their operating system. Nearly 27% of smartphones run on iOS – which also means the same percentage of devices are iPhones.
Across Europe, the mobile device vendor market is dominated by Samsung with a 32.96% market share, followed by Apple with a 30.96% market share, and Huawei with a 15.65% market share.
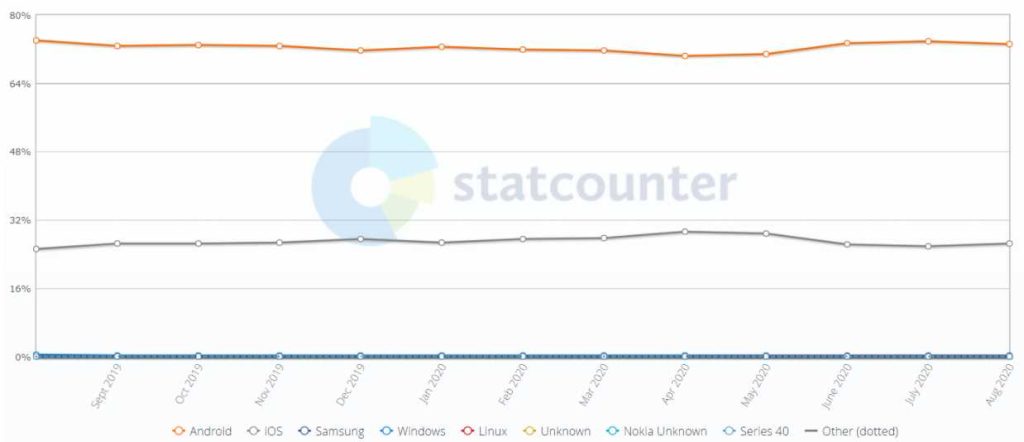 Image Credit: gs.statcounter.com
6. Australia
Android holds 58.8% of Australian mobile OS market share, followed by iOS at 41.4%. And 84.3% of all mobile phones used are smartphones.
With regard to smartphone device vendors, in Australia, Apple commands a bulk percentage of the market share with 54.48%, followed by Samsung at 24.09%, then lastly, Huawei with 9.05%.
iOS vs Android Market Share by Country
1. United Kingdom
According to the latest data from Statista, in 2020, Android OS accounted for 53.24% of the mobile operating system market share in the UK, with iOS commanding 46.6%.
With regards to the best-selling device vendors, Apple confidently leads in the UK with 51.57% market share, followed by Samsung at 28.27% and Huawei at 8.36%.
 Image Credit: gs.statcounter.com
2. Germany
Android is the leading OS of the German mobile OS market, accounting for 70.34% of all smartphones, followed by iOS at 29.01%.
In terms of best-selling device manufacturers, Samsung slightly leads in Germany with 36.72% market share, followed by Apple at 35.56% and Huawei at 14.32%.
 Image Credit: gs.statcounter.com
3. United States
The United States is one of the few countries with iOS leading the mobile OS market game. 59.71% of smartphones utilise iOS and 40.09% run on Android.
Based on projections from Statista, 45.3% of Americans will utilize an iPhone in 2021, while 127.8 million people will employ Android smartphones. Counterpoint Research also determined that in the second quarter of 2020, 46% of smartphones traded in the United States were iPhones.
 Image Credit: gs.statcounter.com
4. Canada
In Canada too, iOS wins the race by accounting for 50.9% of the Android vs iOS market share. On the other hand, 48.74% of smartphones run on Android and experts predict that within a few years, Android will take over this country’s market.
The Canadian mobile vendor market is led by Apple with a significant 52.9% market share, followed by Samsung at 28.16%, and Huawei at 6.86%.
 Image Credit: gs.statcounter.com
5. Japan
Japan is another country in which iOS leads the mobile OS market share, accounting for 62.79% of smartphones. 37.07% of smartphones run on Android.
In terms of device vendors, Apple strongly leads in Japan with 64% market share, followed by Sony at 10% and Samsung at 6.47%.
 Image Credit: gs.statcounter.com
6. South Africa
The Android vs iOS market share of South Africa is dominated by Android at 84.66%. Only 14.84% of smartphones run on iOS.
South Africa’s device market is dominated by Samsung with a 45.7% market share, then followed by Huawei with 28.91% market, then Apple with a 15.6% market share.
 Image Credit: gs.statcounter.com
Are Androids Better Than iPhone?
To be precise, this question has little to no meaning. It is almost impossible to answer this because it’s not the right question to ask. It’s like asking to decide between a bike and car, or a dog and a cat.
It’s not quantifiable like “Who has the biggest market share, Android or Apple?”. The right question is which one is better for you.
If you’re a tech geek, like customization, and have a small budget, you’ll probably want to go for an Android device.
If you are concerned about your device’s aesthetics, like simplicity, and have a significant budget to spend, then you will probably want to go for an iPhone.
You’ll have a lot of hardware options when it comes to Android. Since multiple OEMs (Original Equipment Manufacturers) use Android, you can go for something as low as US$100 or something above US$1000. The cheapest iPhone (iPhone SE) starts at US$399.
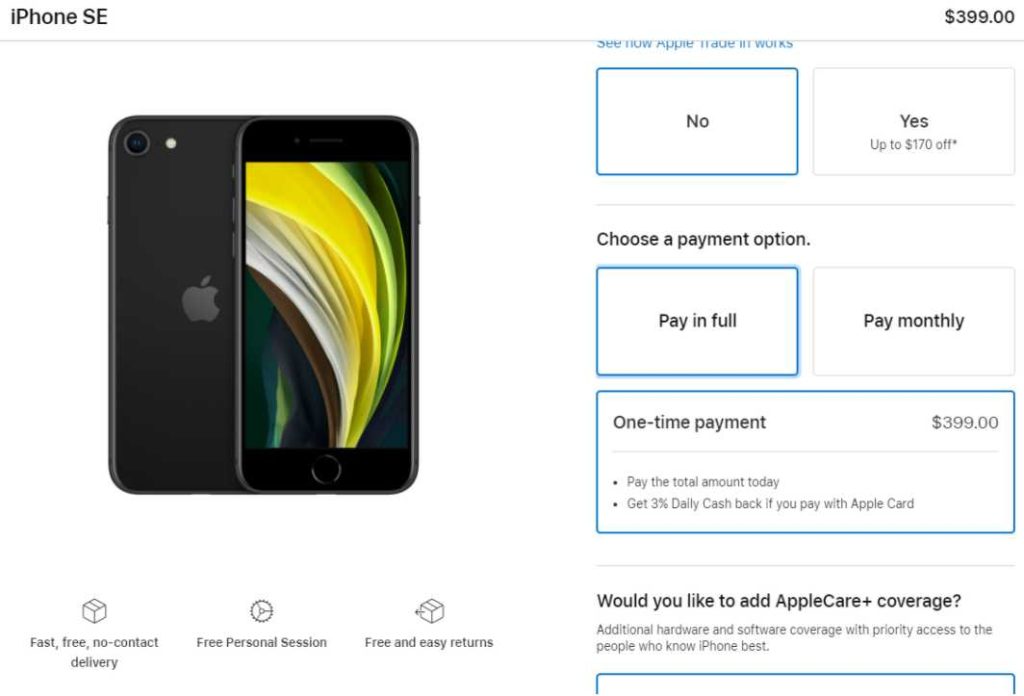 The lowest spec iPhone model costs US$399.
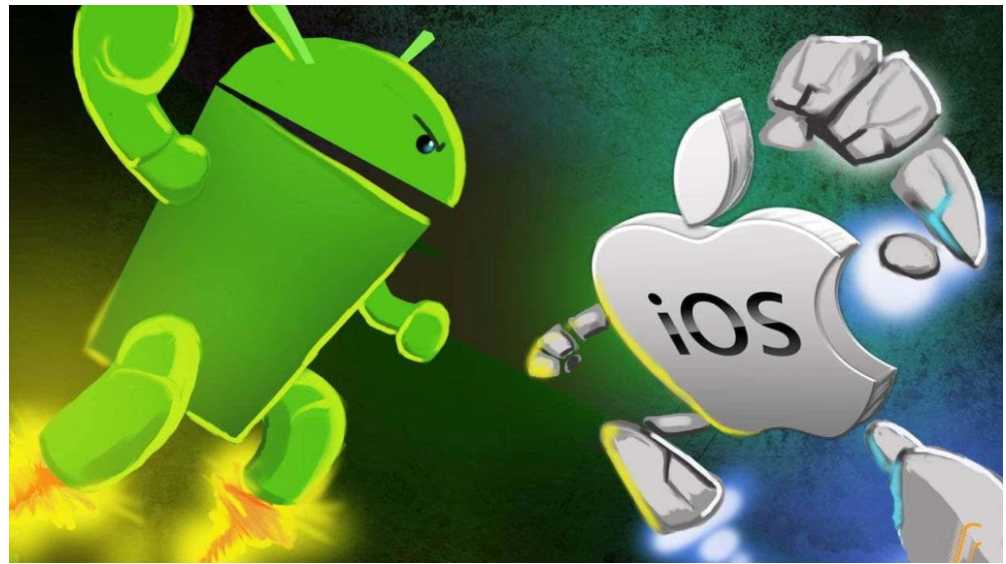
The battle between Android and iOS is a fight between a widely adopted open-source mobile OS and an A-lister, capable of delivering flawless user experience across all of its devices. Both were introduced in the gap of a year, and it took just three years for them to dominate the market.
Both have a different mobile app design philosophy – for example, iOS tries to avoid navigational icons such as the hamburger menu as the placement of the back button coincides with it; whereas Android apps extensively use the hamburger.
Even the target audience of both the operating systems are diverse. Such differences mean that app marketing strategies used for either platform will be different. Even the average mobile app developer salary of iOS developers are higher than their Android counterparts.
Take a look at how both the operating systems came to prominence.
Android: The Story
Released in November of 2007 by Google, Android OS, a Linux-based software system, was initially developed to become a digital camera platform. The HTC Dream (or T Mobile G1 in some countries) was the first smartphone to run on Android, and the OS is now a globally dominant force.
 HTC Dream – the first smartphone running on Android. Image Credit: androidpolice.com
Contrary to popular belief, Android isn’t Google’s brainchild, and the OS was instead bought from its creators. Interestingly, Samsung had the opportunity to buy Android, but they failed to see its potential and passed the opportunity.
Even though Windows phones are out of the scene, Microsoft receives nearly US$2 billion from Android, every year, in the form of patent royalties. So it’s safe to say that Microsoft makes more money out of Android phones than Windows phones.
The first two versions of Android weren’t named, although there are many rumours it was called Astro and Bender. As you know, until Android 9.0 the versions were named after desserts in alphabetical order. Here’s a list of them.
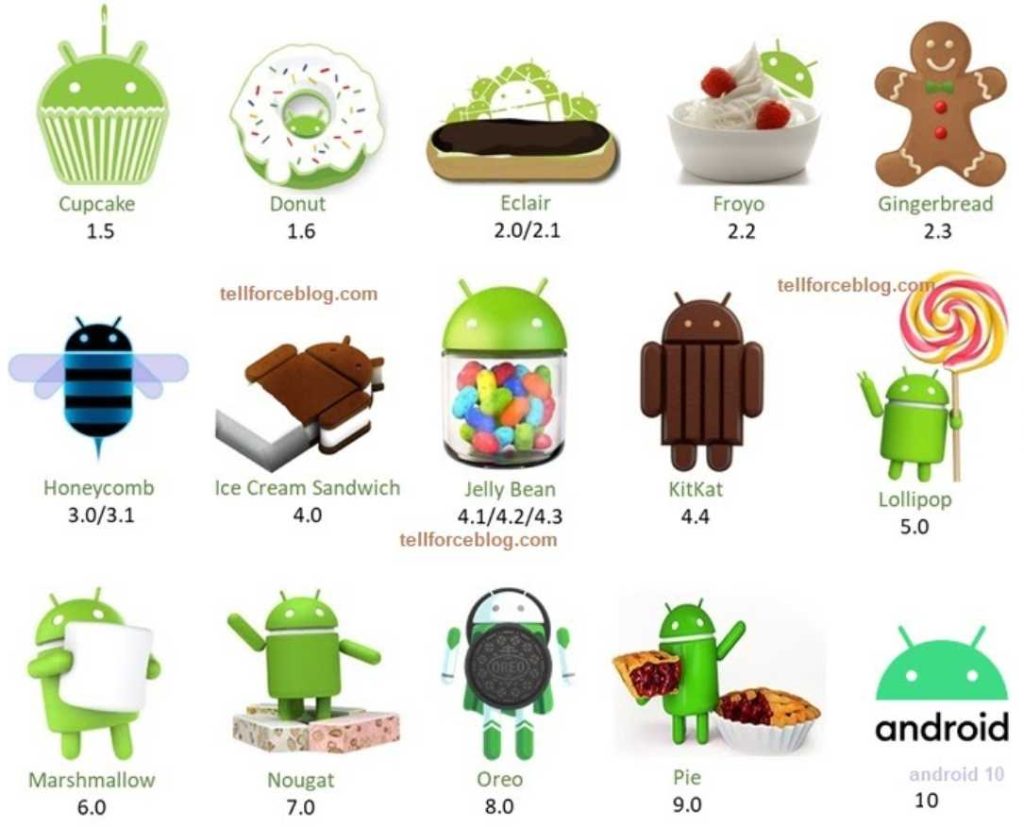 The Android Evolution. Image Credit: tellforceblog.com
- Android 1.5 – Cupcake
- Android 1.6 – Donut
- Android 2.0 – 2.1 – Eclair
- Android 2.2 – 2.2.3 – Froyo
- Android 2.3 – 2.3.7 – Gingerbread
- Android 3.0 – 3.26 – Honeycomb
- Android 4.0 – 4.0.4 – Ice Cream Sandwich
- Android 4.1 – 4.3.1 – Jelly Bean
- Android 4.4 – 4.4.4 – KitKat
- Android 5.0 – 5.1.1 – Lollipop
- Android 6.0 – 6.0.1 – Marshmallow
- Android 7.0 – 7.1 – Nougat
- Android 8.0 – 8.1 – Oreo
- Android 9.0 – Pie
Sadly, from Android version 10, it is called just Android 10, Android will be going on a diet and won’t name any of the versions after desserts or sweets. Google believes that instead of using dessert names, numbers will be more relatable and understandable.
Suppose you’re a freelance app developer (or an aspirant trying to learn how to become a mobile app developer). In that case, you’re more likely to earn from Android than iOS apps by employing app monetization strategies such as in-app ads.
Running specific mobile marketing campaigns can be tedious for iOS apps as users are prompted to allow or disallow push notifications right after an application is installed.
iOS: The Story
In 2007, the iPhone was awarded the title of “Invention of the Year”. Also, Apple’s App Store played a crucial role in bringing the term “app” to the public and defining what is a native app. The App Store is also the first online space where one could legally download apps.
 Steve Jobs unveiling the first iPhone. Image Credit: businessinsider.in
Just like Android, iOS also has an interesting origin story. It initially started as a Tablet Project, and later Steve Jobs felt the technology could be applied to mobile phones – hence, the iPhone. Jobs wanted the iPhone project to be top secret and called it “Project Purple”.
Only the engineers already employed by Apple could work on the iPhone project. Also, to maintain its secrecy, none of the engineers was given the full details of the project – instead, they were told that it would require extra work at night and on weekends.
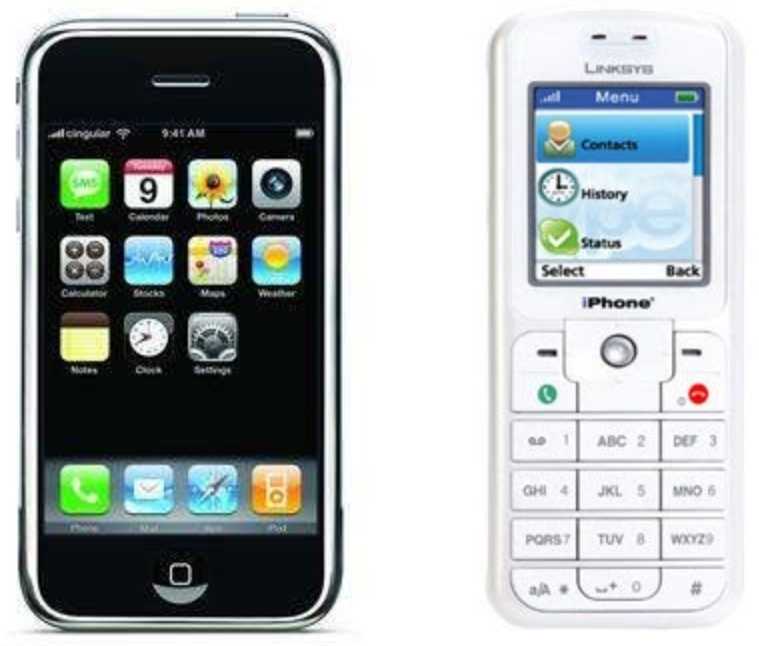 Apple’s iPhone vs Cisco’s iPhone. Image Credit: wired.com
Apple wasn’t the first company to name their smartphone the iPhone. Cisco had already registered the name “iPhone” for its VoIP phone and therefore sued Apple. Both the companies negotiated for two years and then settled to work together on some future projects.
Apple holds around 200 patents for the iPhone. If you’ve got a unique, mind-blowing idea, we recommend you to patent it as well. Check out our guide on how to patent an app for that matter.
Apple still hasn’t granted permission to a third-party manufacturer to use the iOS and probably never will. Having an exclusive operating system for its devices makes it easier for the organisation to develop and optimize the hardware and software to complement each other.
And once you enter the realm of Apple, only a few make it out. Apple’s integration across multiple devices, namely iPhone, iPad, Apple Watch, and MacBooks is so seamless that a user will have minimal to no reason to move out from their ecosystem.
 Apple introduced iPadOS, a new OS for iPads. Image Credit: theverge.com
In 2019, Apple also introduced a separate operating system for its iPads called the iPadOS. It’s the successor to iOS 12 on iPad and on release, had all the new features of iOS 13, along with an updated home screen, Apple Pencil features, improved multitasking functionality, and even support for external drives.
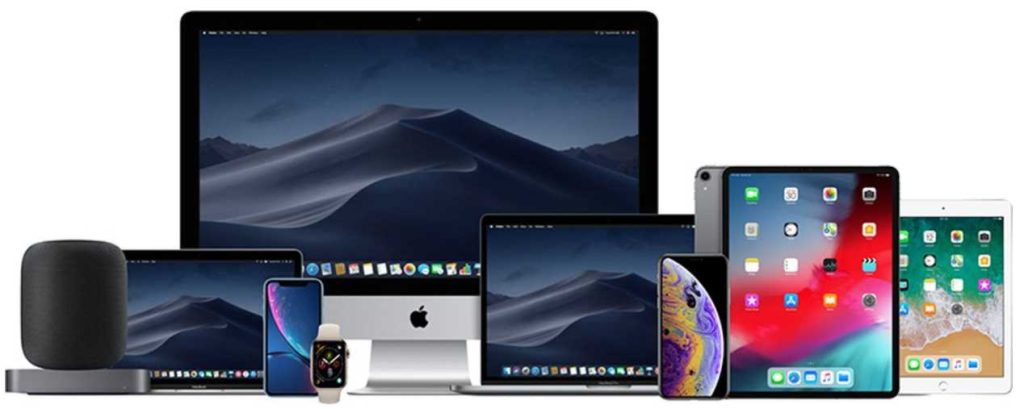 A lineup of Apple’s products. Image Credit: macrumors.com
For Apple, the iPhone is a gold mine. Even though they sell innovative products such as the MacBook, iPad, and iMac, iPhones remain their most popular and profitable product – accounting for 70% of all revenue.
Even though Apple and Samsung appear to be direct rivals – still, the processors that power the iPhones are manufactured by Samsung. And here’s a fun fact – the most expensive component of an iPhone is its retina display. Following the display, the second most costly component is the wireless chip from Qualcomm.
Do you know which country has most iPhone users?
It’s China. But iPhones aren’t the most used smartphones there. Instead, it’s Huawei. With a population of more than 1.4 billion people, it’s not really surprising that a country can have the highest number of iPhone and Huawei users.
Apple devices offer a seamless user experience across all of its devices. Since multiple OEMs such as Samsung, Huawei, and Motorola produce Android devices, there are notable differences among each. Even the UI design of a low-spec Samsung device will differ when compared to an expensive model of the same manufacturer.
With the iOS 14 expected to release this fall, app advertisers will have a hard time utilising techniques like location-based advertising as users can choose not to share their precise locations and also stop tracking to avoid personalised ads.
If you’re excited to know more about the differences between iPhone users and Android users, check out our comprehensive article that discusses all aspects in detail.
Interesting Facts About Mobile OS (For the Tech Geek in You)
Generally speaking, 2020 was a record-setting year for both ordinary mobile apps and game-based mobile applications. Furthermore, user spending on Apple’s App Store and Google Play took off higher than ever as more mobile users resorted to using their cell phones for schooling, work, and amusement.
As previously cited, buyers spent almost $111 billion all around the world, and this figure demonstrated a 30.2% year-over-year development from 2019 when application stores made approximately $85.2 billion.
A notable sensation was TikTok (known as Douyin in China). Tiktok reached a $50B valuation after being one of the best-selling non-game mobile applications in 2020. Other eye-popping statistics to tickle your fancy are:
- The sales of smartphones rocketed from 122.32 million in 2007 to 1.57 billion in 2020.
- Although the last line of devices running the Blackberry OS was manufactured in 2015, millions still use it.
- Tizen OS, Samsung’s prodigy, is used by the majority of Smart TVs.
- Android is the most famous OS, adopted by 40% of all types of devices.
- Android devices are more vulnerable to malware attacks.
- One in three smartphones sold in China in the second quarter of 2020 was 5G enabled.
- By 2025, there will be nearly 1 billion 5G smartphones.
In Conclusion
There’s an industry joke that although Google is a part of Alphabet, in the US, “A” always stands for “Apple”. It is fascinating to see how Apple, which is the only manufacturer that uses iOS, stands rigid in the US and Japan, even with hundreds of manufacturers using Android.
Just like how cars and bikes are uniquely essential for different owners, people choose between an Android or iOS device, based on the desired features. As a mobile app developer in Malaysia, you understand the significance of catering to these preferences. By 2023, it is estimated that only Android and iOS devices will be sold worldwide.
But the technology industry always has a habit of introducing something new when you least expect it. Maybe, in a few years, something better than Android or iOS would have conquered our devices and hearts – we really can’t be sure.
Related Sources to Read:
–When to Consider Mobile App Development for Your Business
–Why Mobile Apps Are Important for Your Business
–Factors to Consider When Hiring a Mobile App Development Company
–Mobile App Development Cost Estimate in Malaysia
Looking for a top-notch Mobile App Developer Malaysia? Your search ends here! Contact us now to bring your app idea to life with expert developers.


